How much do our online food delivery choices reflect our preferences, habits, and lifestyle? This is the question at the heart of my first project with DAA, a data bootcamp led by Avery Smith. With an engineering background and some experience in machine learning, my aim is to expand my skill set through this bootcamp, with a focus on mastering tools such as SQL, R, and Tableau. For this specific project, we’ll be utilizing Excel to analyze the data. Welcome to my first project in this new chapter of my data analysis journey!
Dataset
For this project, I will be using a modified version of a DoorDash dataset called iFood. This dataset includes valuable information such as financial information, customer demographics, and product preferences.
Questions
I set out to answer a few questions:
- What is the relation between income and amount spent on online orders?
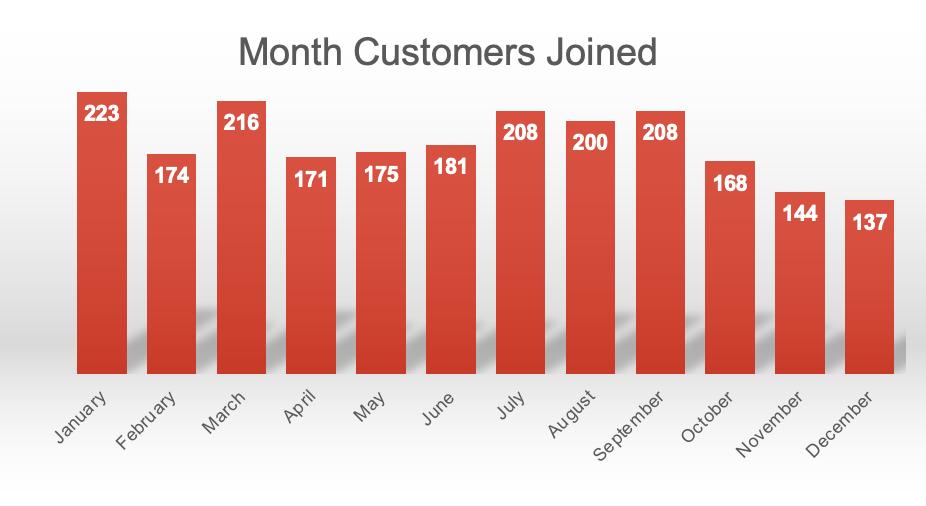
- What times of the year attract the most customers?
- What products do customers spend the most on?
- How does the number of kids affect spendings?
- What age groups spend the most?
Findings
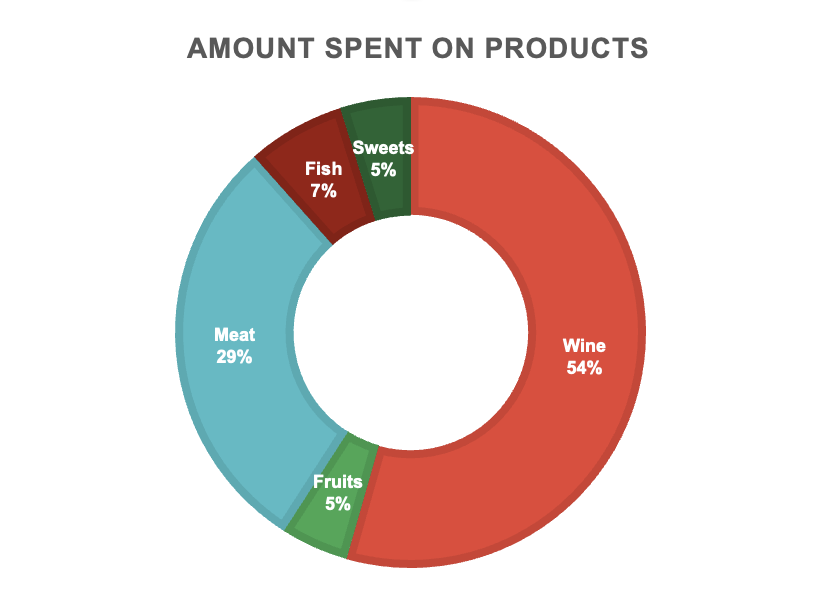
This dataset has given us some interesting insights. For starters, over half (54%) of the cash that customers shelled out was for wine orders. Personally, I’ve never ordered wine through online delivery, so this had me doubting the stats a bit. But if these numbers aren’t lying, then we need to see this dataset in a new light - it’s about a food and wine delivery service, with the wine part being key.
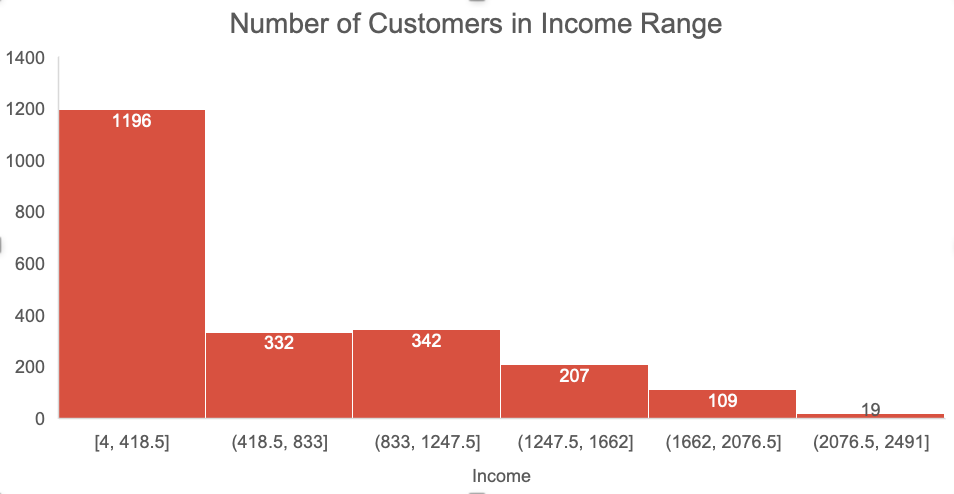
The data also showed a strong link between a person’s income and how much they’re spending on delivery, with an r-squared value of 0.6774 in the regression analysis. This tells us that income does play a big role in how much people are willing to spend on deliveries. It’s also worth noting that most people spent somewhere between 0 and 400 bucks on delivery during the year.
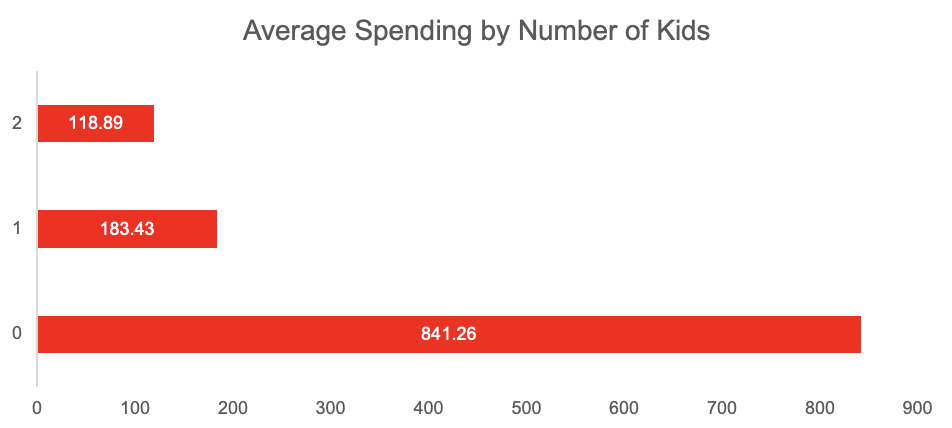
Now, let’s talk about kids. Those with no kids spent more on delivery than those with one or two kids. This could be because maybe they’re drinking more wine or they just have more cash to throw around. These figures are averages for people with 0, 1, or 2 kids, not totals.
Age also plays a part here. The 36-50 age group ordered the most, with the 51-65 group coming next. The 24-35 group, however, didn’t order much.
Lastly, the data showed some patterns on when people choose to join the service. January and March saw the most sign-ups, while November and December were less popular. All these findings help shape our understanding of the customers and their behaviors.
Takeaways
In the context of this dataset, which I’m analyzing from an academic standpoint, I’m assuming it to pertain to a food and wine delivery service. Though I have some reservations about the dataset’s real-world accuracy, I’ll still be treating it as valid for the purposes of my study. It’s evident from the data that our service has a greater appeal to individuals aged 35 and above. Consequently, the company should strategize marketing campaigns to resonate with this older demographic. More specifically, It should target high-income, middle-aged people with no kids. These campaigns may be more effective in peak months like January, March, July, or September.
If this delivery service seeks to maximize profit, it should collaborate with companies that produce goods reflecting the consumption data revealed in the study. This would ensure that the services align with customer preference. It would be beneficial to research company’s profit margins on various items. Such an investigation could yield valuable insights into potential strategies for increasing profitability.
