In today’s healthcare industry, the sheer volume of data generated can provide invaluable insights into patient outcomes, particularly for those managing chronic conditions such as diabetes. A crucial factor to consider is the length of hospital stays, as this can directly impact both patient care and hospital efficiency.
In this project, I will be assuming the role of a data analyst at a hospital, utilizing a comprehensive dataset from a decade-long study carried out across 130 U.S. hospitals. The dataset specifically pertains to the hospital records of diabetic patients.
I’ll be utilizing Structured Query Language (SQL), a robust tool for handling and interrogating complex datasets, to navigate through seven unique scenarios. Each scenario will necessitate the use of various SQL functions, such as JOINs, UNION, CASE WHEN, CONCAT, and more, to answer a specific question posed by the hospital administration. The questions range from exploring the duration of hospital stays to generating detailed reports on specific patient demographics.
The Project
Tools & Data Set
For this project Azure Data Studio was used. The MySQL plugin was used in order to use the MySQL format instead of T-SQL. The data, drawn from a decade-long study spanning 1999 to 2008 and involving over 130 hospitals in the United States, specifically features hospital stay records for diabetic patients. The dataset can be accessed here, while the comprehensive hospital records and the study itself can be found here.
Query 1: Visualizing Length of Stays
The healthcare data analysis team lead is keen to explore the distribution of the length of hospital stays measured in days. They are particularly interested in determining whether the majority of patients have a length of stay less than 7 days. It’s crucial for the hospital to confirm that any patients with stays exceeding this duration are indeed in need of acute care.
Although SQL isn’t traditionally associated with data visualization, an innovative approach has been implemented for some initial exploratory data analysis. This method exploits SQL’s calculation functions and uses rudimentary histogram bars for data visualization. In other words, the heavy lifting of number crunching is done by SQL, and basic text characters are utilized to visually represent the data.
Query 2: Number of Procedures for Medical Specialties
The hospital’s new Director seeks to understand which medical specialties are performing the highest average number of procedures. They’re interested in a comprehensive list of specialties, each with their average procedure count. The Director requested specialties with an average procedure count exceeding 2.5 and a total procedure count surpassing 50.
To meet this requirement, an additional column was added to display the AVG number of procedures per specialty, grouped accordingly with the GROUP BY function. Furthermore, the ORDER BY function was used to sort these groups in descending order by average number of procedures. However, some specialties showed rounded averages, potentially due to low patient counts. Thus, the data was cleaned up using the ROUND function for a more legible decimal format. A COUNT function was applied, adding a column that highlighted the number of patients treated by each specialty.
To ensure the Director’s focus remains on significant data, specialties with less than 50 patients were filtered out. This was achieved using the HAVING function, which effectively filters on aggregated rather than individual rows, ensuring only specialties treating more than 50 patients were included in the final list.
Query 3: Frequency of Lab Procedures and Discrimination
A request was made by the Chief of Nursing to investigate whether the hospital is demonstrating any racial bias in the frequency of lab procedures conducted. To address this inquiry, two separate databases needed to be combined: one containing the health records and the other encompassing the demographic data of patients. Utilizing the INNER JOIN function proved instrumental in aligning the patient ID numbers from both databases. Consequently, this paved the way to analyze any potential correlations between patients’ racial identities and the number of lab procedures undertaken.
Query 4: Number of Lab Procedures and Length of Stay
The head of the hospital is interested in investigating the correlation between the quantity of laboratory procedures and the duration of patient hospital stays. Management is particularly curious to determine if there’s a trend indicating that patients who undergo numerous lab procedures also have extended hospital stays. For the purpose of this investigation, patients are classified into three groups based on the number of lab procedures they undergo: those with few procedures (0-25), those with an average number of procedures (25-55), and those undergoing many procedures (55+).
The CASE WHEN function was used to split the data into these three groups for study. To make sure everything was working correctly, a check was done before grouping the data further. This was done by looking at the average stay in the hospital and the number of lab procedures, as shown in the next part of the report.
Query 5: Demographics and Medicine
Subsequently, a research colleague expressed interest via email in conducting a medical test. The target population included individuals of African American descent or those with an “Up” status for metformin. The task at hand was to provide a list of relevant patient IDs in the shortest possible time frame.
Thanks to the UNION function, it was possible to merge the two data sets - health records and demographic information. Rather than appending columns like with a JOIN, the UNION function stacks matching data from two tables into a single column, provided the column of interest is common to both tables. In this case, that was the patient_nbr.
The ensuing query was constructed to identify all pertinent patients, either African American or flagged for Metformin “Up”. This information was promptly forwarded to the research team for their testing requirements.
Query 6: Outliers of Success
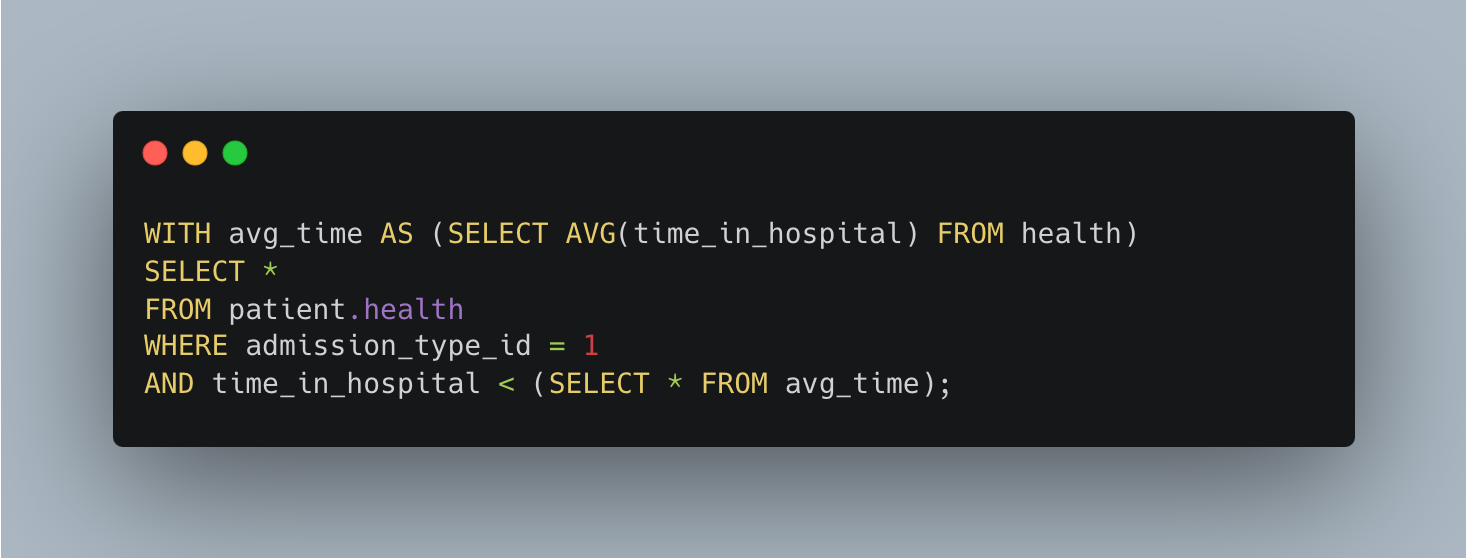
The Hospital Administrator expressed interest in showcasing some of the hospital’s major success stories. They were specifically interested in instances where patients were admitted due to emergencies (with an admission_type_id of 1) but managed to have a stay shorter than the hospital’s average.
A method employed to facilitate this was through a Common Table Expression (CTE), using the WITH function. While the query itself was relatively straightforward and easy to manage, the primary advantage of employing the WITH function was its ability to generate a variable that could be subsequently invoked without necessitating a subquery.
Query 7: Patient Summaries
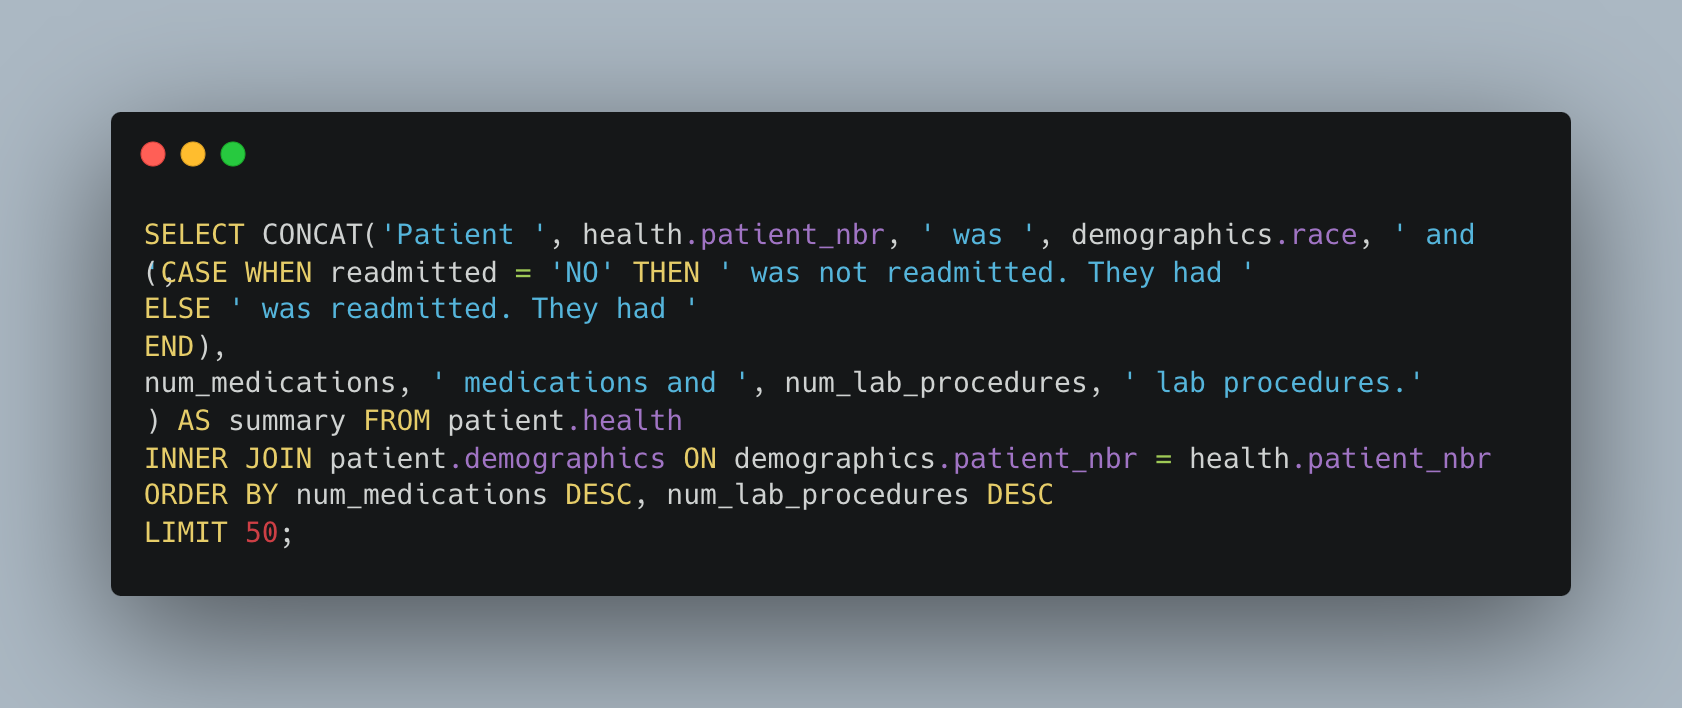
The Hospital Administrator requested a comprehensive overview for the top 50 patients in terms of medication intake, with any ties to be resolved based on the quantity of lab procedures conducted (those with the highest count would be prioritized). They wished to receive a structured summary following this template: “Patient 2383 was Caucasian and was readmitted. They had 21 medications and 32 lab procedures.” In this template, all the elements in bold are dynamic and will change according to the actual data; the rest of the text remains constant in each entry.
To fulfill this request, we employ all our previous SQL knowledge and techniques, incorporating the CONCAT function. This function is instrumental in including textual elements or strings in our query, not just numerical data. What follows is the configuration of the query implemented for this purpose.
What I Learned
- Visualizing Data with SQL
- Use of HAVING after Data Aggregation
- Merging Data with JOINs
- Data Categorization with CASE WHEN
- Combining Data with UNION
- Utilizing CTEs for Readability
- Handling Textual Data with CONCAT
Conclusion
This project served as an enlightening exploration into the versatility of SQL in the context of healthcare data analysis. From providing insights into hospital stay durations, revealing procedural trends among medical specialties, detecting potential racial biases, to generating customized patient reports - the utility of SQL was clearly showcased.
Various SQL functions were used - JOINs, UNION, CASE WHEN, CONCAT, and more, demonstrating how they can be effectively used to extract meaningful information from complex healthcare data. These powerful functions allow data analysts to manipulate, transform, and present data in ways that help decision-makers make informed, data-driven choices.
This journey was not just about understanding how to apply SQL, but more importantly, how to leverage it to create narratives, highlight patterns, and inform strategic decisions. Ultimately, the intersection of healthcare and data analytics, as highlighted in this project, points towards an exciting future where data-driven insights can contribute significantly to enhancing hospital efficiency and patient care.


