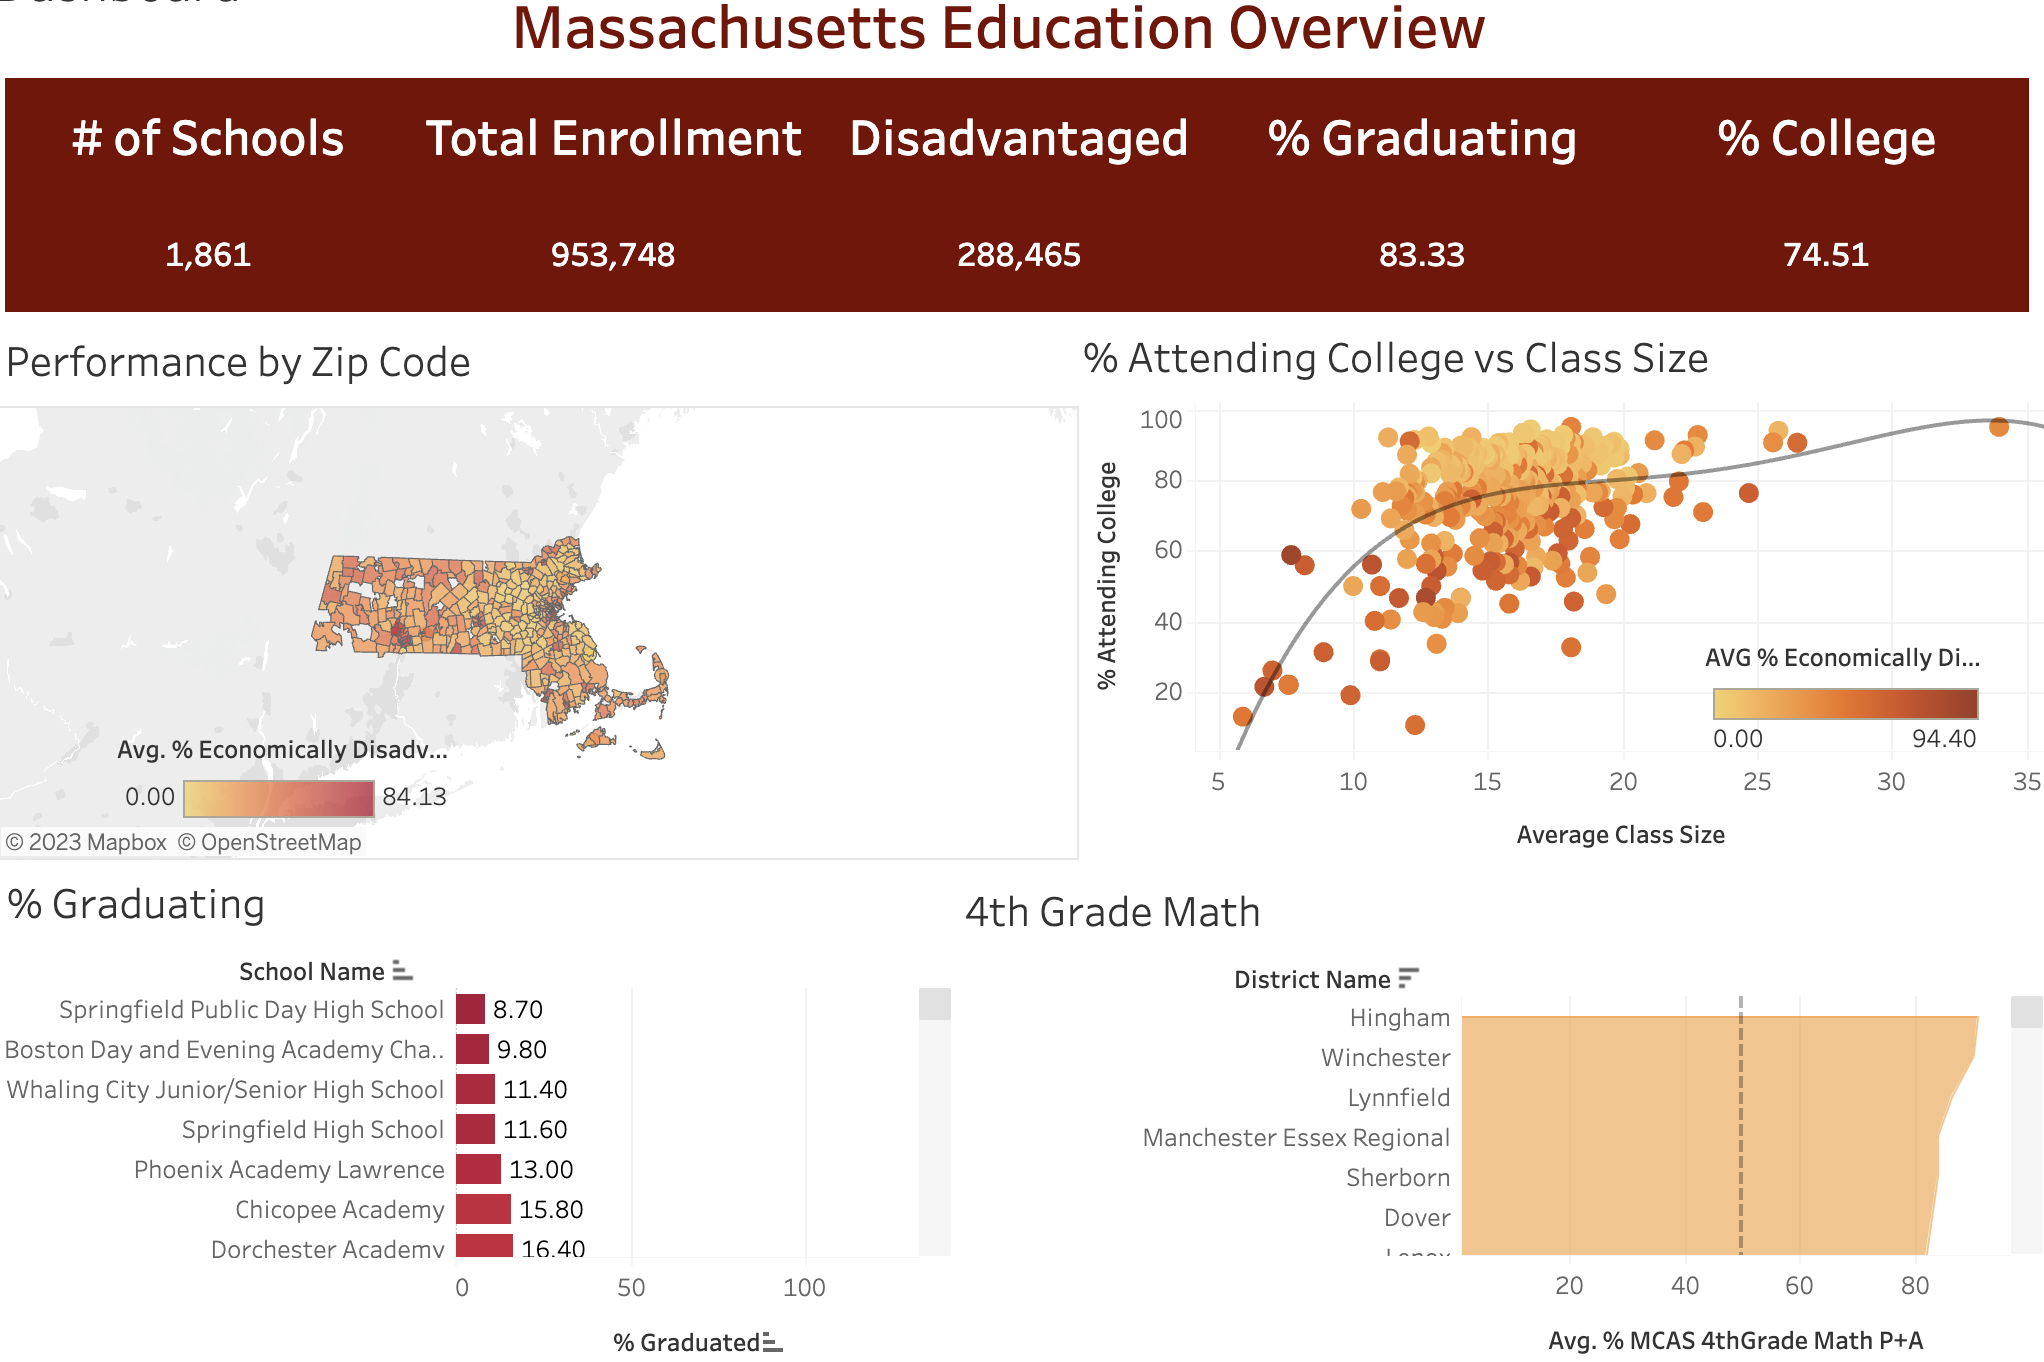
Have you ever wondered what makes one school excel while another struggles? I looked into Massachusetts public schools’ data, using the powerful visualization tool, Tableau, to answer this question. It allowed me to analyze and understand the complex patterns affecting educational performance. My insights are captured in an interactive dashboard, including a map of Massachusetts where each zip code is represented by a clickable region. Feel free to explore this dashboard by clicking on the image below to uncover the fascinating trends that affect this state’s education system.
The Project
For this project, I will focus on trends in Massachusetts public schools using the “Massachusetts Public Schools Data” dataset from Kaggle. This dataset contains a range of information including student demographics, school performance, graduation rates, and college attendance statistics from 2017. The ultimate objective is to uncover patterns and discern which factors contribute most significantly to underperformance in Massachusetts educational institutions.
Some questions I will aim to answer:
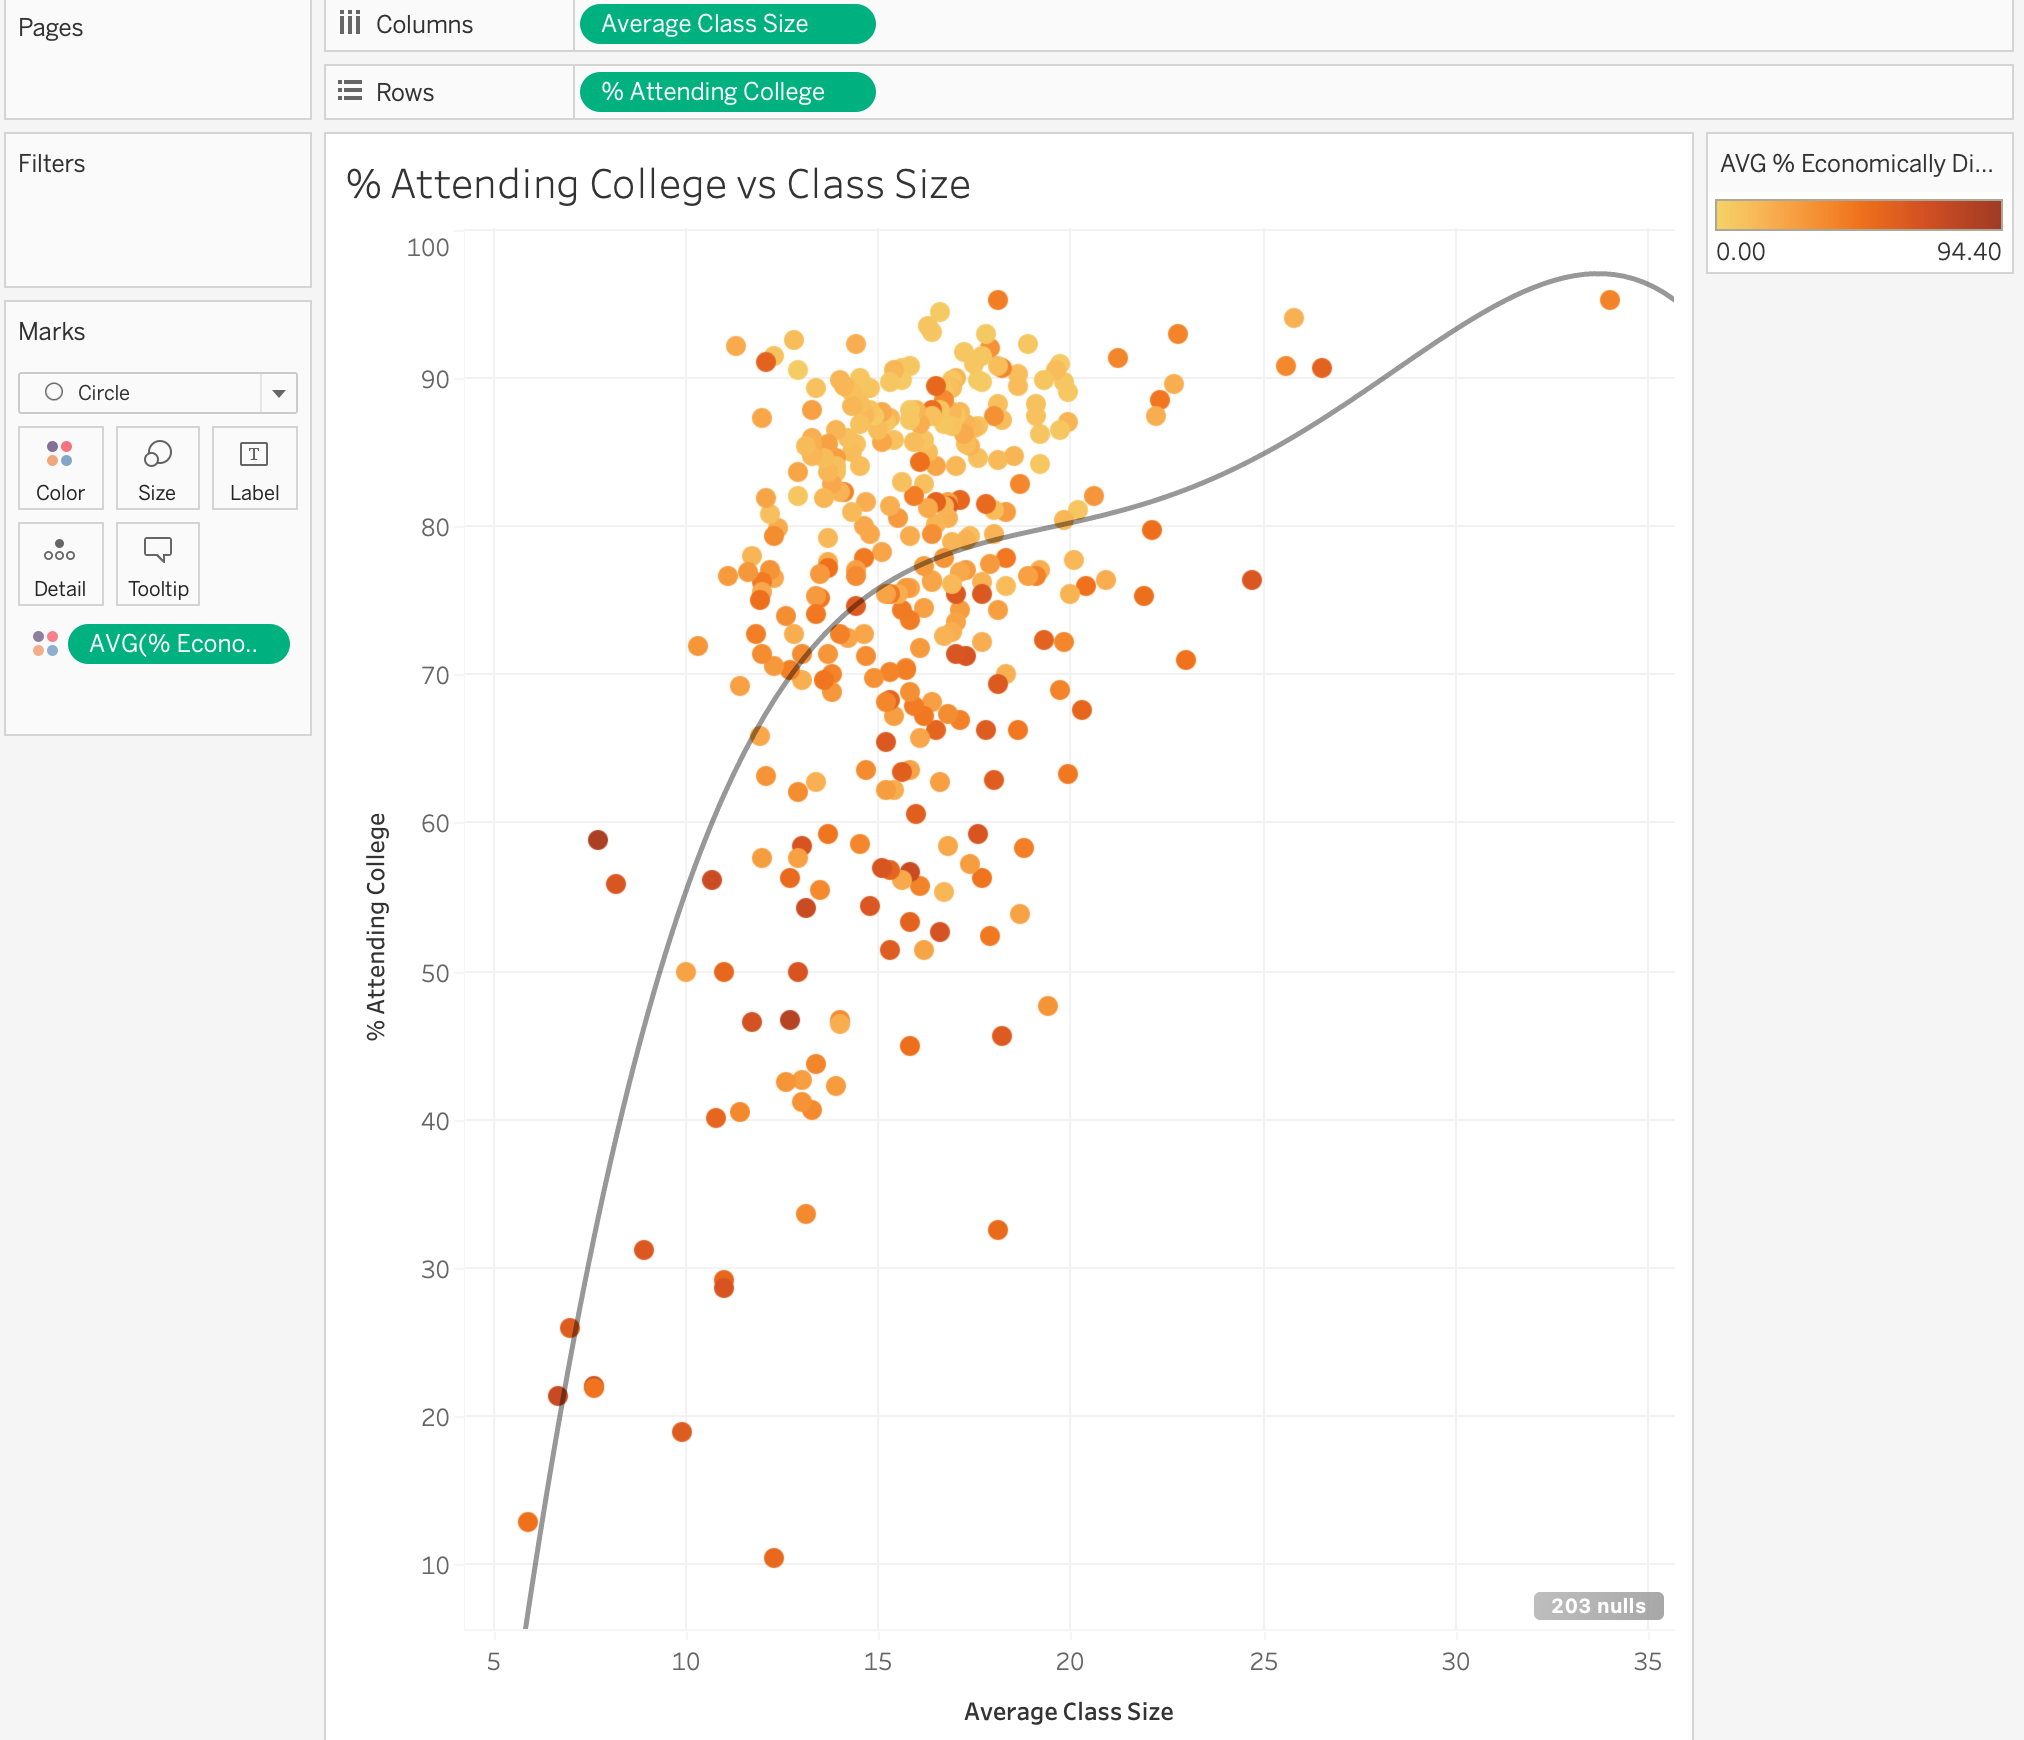
- How does class size affect rates of college attendance?
- How does a school being economically disadvantaged affect college attendance?
- How does a school being economically disadvantaged affect graduation rates?
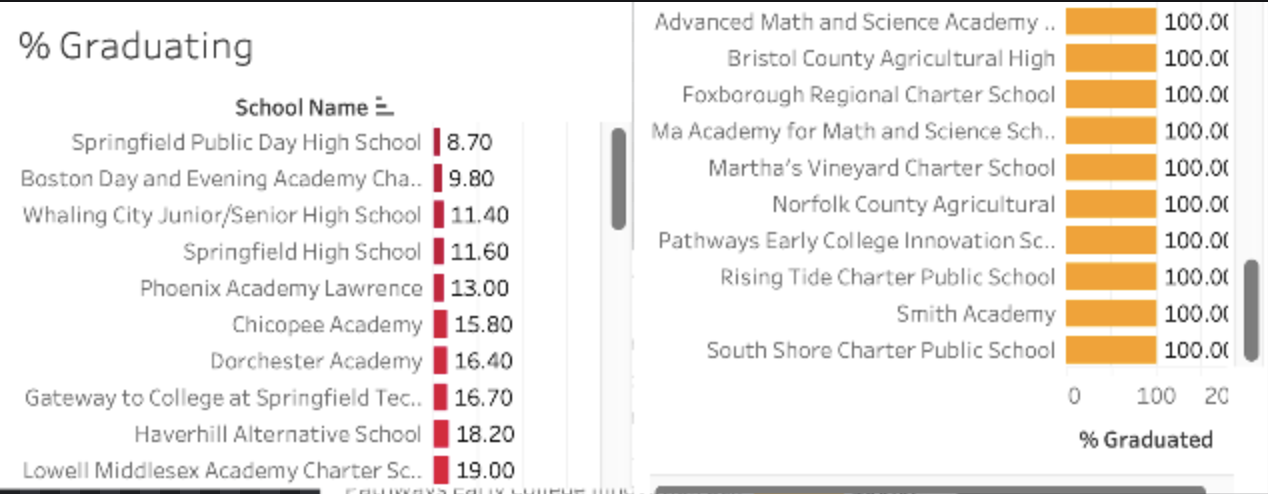
- How much do graduation rates vary from school to school?
- What kind of trends can be observed in primary education?
Findings
The initial observation that grabbed my attention was an unexpected positive link between class size and college attendance rates. This was surprising, as I had always assumed smaller classes meant better outcomes. However, once a 4th degree polynomial regression line was applied to the scatter plot, the relationship was clear. Interestingly, this trend holds up until class sizes reach around 35 students. Although this needs more investigation due to limited data points for class sizes over 25, it’s evident that classrooms with over 15 students perform significantly better than smaller ones.
The second finding was how economic disadvantage impacts college attendance. This was a less surprising but very significant trend. The percentage of college attendees among economically disadvantaged students varied greatly, ranging from as low as 10 percent to as high as 95 percent. Most high-performing outliers were charter schools, a fact revealed by Tableau’s feature allowing for a closer look at individual data points. This significant difference in the impact of economic disadvantage on college attendance brings out the deep societal implications of these observations.
A key trend visible in the data is the variation in graduation rates among Massachusetts high schools. Despite Massachusetts being renowned for its high-quality public education, the schools with the lowest 10 graduation rates all sit below 20 percent. By interacting with the bar graph on the Tableau dashboard, you’ll notice that most of these underperforming schools serve a high proportion of economically disadvantaged students. In stark contrast, the top 10 schools, all boasting a flawless graduation rate of 100 percent, serve far fewer students from disadvantaged backgrounds. This clear divergence shines a light on the educational disparities that exist even within one of the nation’s leading public school systems.
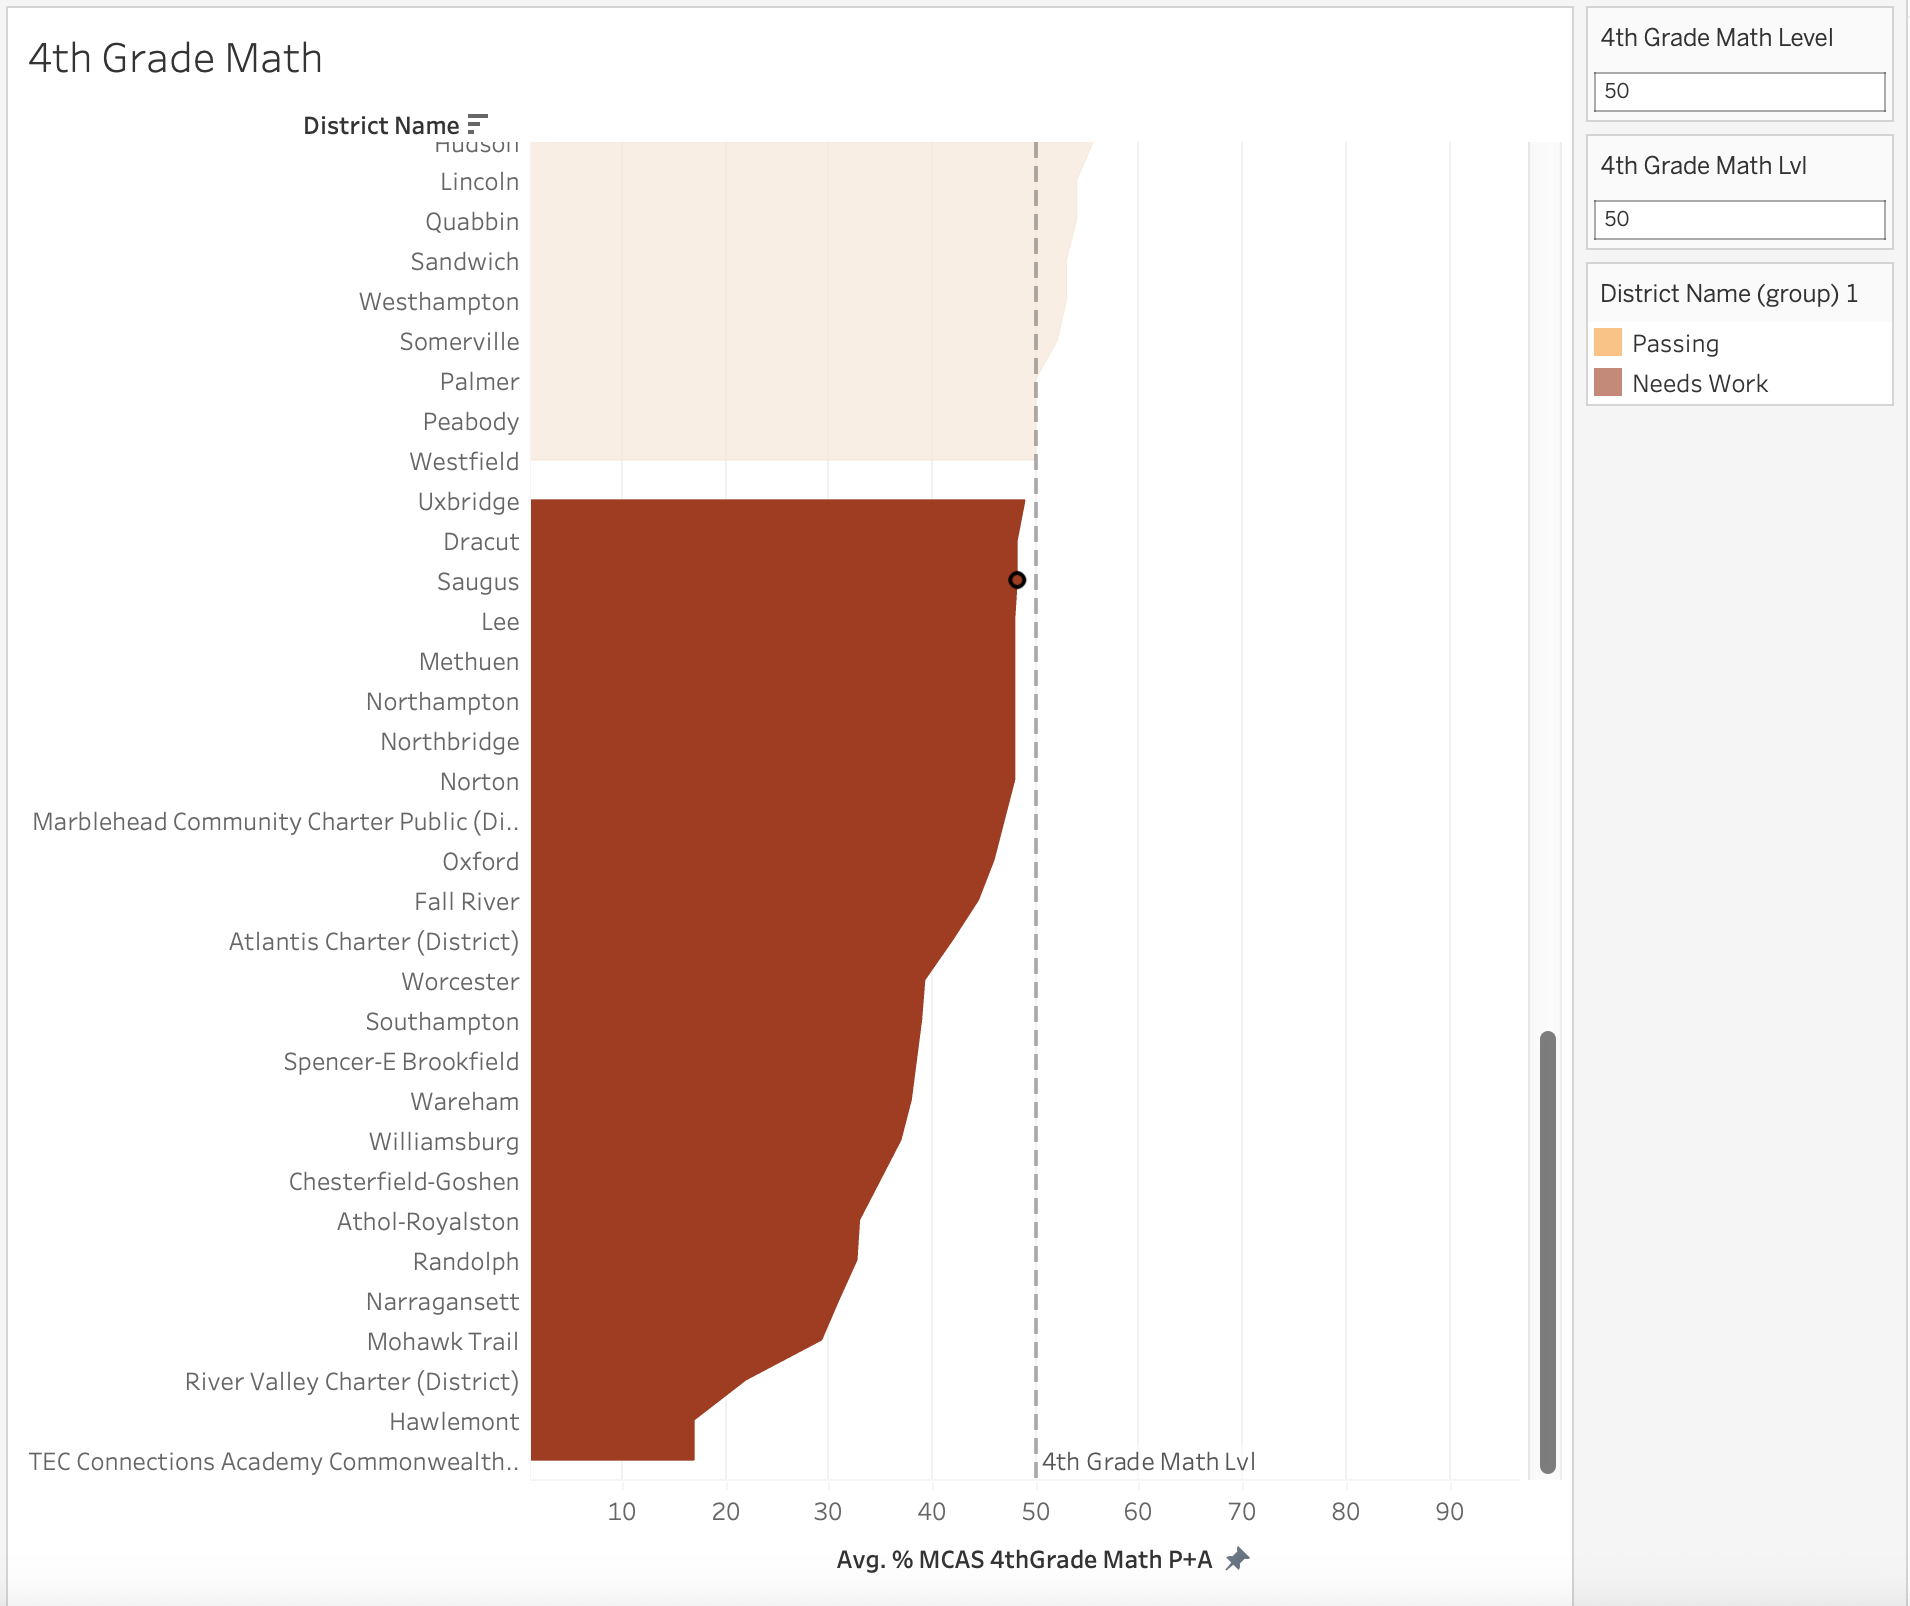
Let’s focus on one particular measure that underscores an area for potential enhancement in Massachusetts public schools. The rise of tech jobs and their promise of social mobility underscore the importance of early education, particularly in areas like mathematics. These formative years lay the groundwork for lifelong learning habits. For this analysis, I’ll concentrate on 4th grade math MCAS scores. The visuals below spotlight school districts falling below the 50th percentile, as marked by the dividing line. If you interact with these schools on the Tableau dashboard, you can see the proportion of economically disadvantaged students in these districts. It’s a revealing glance into how economic disparities can intersect with academic performance, even from a young age.
Key Observations
- Across various indicators such as graduation rates, college attendance, and primary school performance, economically disadvantaged school districts exhibit poorer overall performance.
- Attending a charter school appears to offer economically disadvantaged students the greatest chance for educational advancement and improvement in life prospects.
- Schools with larger class sizes tend to demonstrate higher rates of graduation and college attendance.
How to Improve
To enhance school performance in economically disadvantaged areas, Massachusetts should center its attention on three key areas according to this data.
Firstly, improving math scores in primary schools is crucial, particularly in less affluent neighborhoods. This is not merely about achieving proficiency in a subject; it’s about equipping kids with the tools they need for a bright future. Strong math skills not only open doors to rewarding careers in sectors like tech and engineering but also develop critical problem-solving skills applicable in everyday life. This means kids from less privileged backgrounds, when they excel in school and land great jobs, have the opportunity to climb the social ladder and escape the economic circumstances of their parents. Hence, prioritizing math in primary schools isn’t simply a numbers game, but a strategic step towards building a brighter future for these kids.
Secondly, the state should place a higher priority on widening access to charter schools for economically disadvantaged students. Data suggests that attending charter schools provides them with the best shot at educational advancement and improved life prospects. By broadening the availability and enrollment options in charter schools, Massachusetts can offer these students improved educational opportunities, creating a pathway to academic success and abundant future possibilities.
Lastly, Massachusetts should strike a careful balance when it comes to class sizes. While data indicates that larger class sizes can correlate with higher graduation rates and college attendance, the state should also focus on personalized attention and individualized support within these larger classes. This balance could be achieved with targeted measures like small-group instruction or personalized tutoring. By ensuring that students, particularly those from economically disadvantaged areas, receive the necessary academic support, Massachusetts can enhance their educational outcomes, thereby helping them reach their full academic potential.
