Welcome, data enthusiasts. In my third project with the DAA boot camp, I explored the complex landscape of International Development Association (IDA) World Bank data with SQL. The IDA, a critical arm of the World Bank Group, works tirelessly to combat poverty in the world’s most vulnerable regions, allocating substantial funds for an array of projects each year.
Two key questions:
- Over the past decade, which country has emerged as the top beneficiary per capita from the IDA’s funds?
- How can the many projects supporting India in the past decade be categorized in simple terms?
By applying SQL to this data-rich context, I shed light on both these questions. So, let’s embark on this journey, using SQL as our compass to navigate the vast ocean of global development funding data.
The Project
For this project, Azure Data Studio was used to run SQL. Starting out with question 1, the import wizard tool was used to import two tables into the database. These two datasets were used:
After importing these two tables, a CTE was created. A CTE works similarly to a subquery, but it is much easier to read. The CTE was used to extract principal disbursements that occurred exclusively in the past decade. Additionally, SUM was used along with GROUP BY to find the total amount of principal for each country within this time period.
Next, the CTE was combined with the population data using INNER JOIN. In addition to country and principal columns, a column was selected that represented the population data for each country from 2013. Additionally, a column was created that showcased the principal column divided by the 2013 population.
Finally, ORDER BY was used to sort the principal disbursements per capita in the last 10 years in descending order. Tuvalu received the most principal per capita in the past decade. 

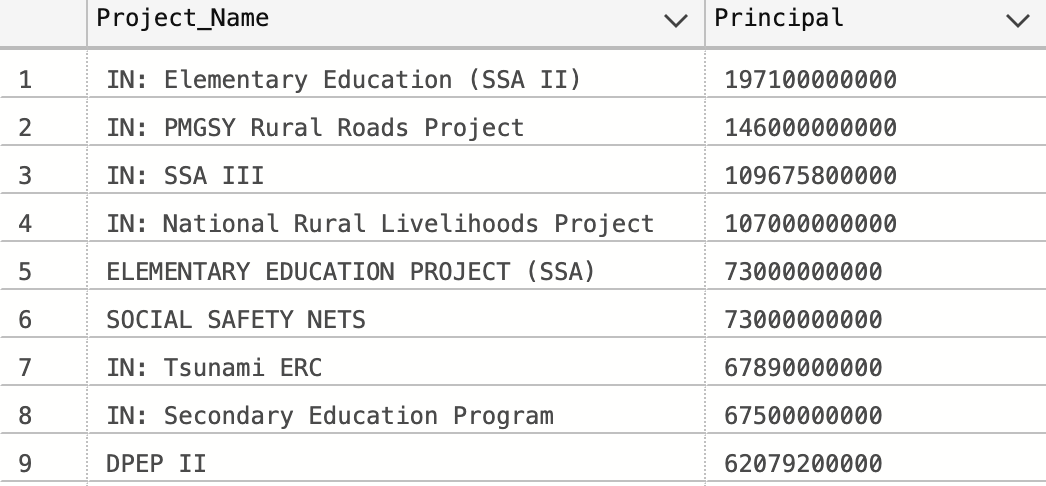
Moving on to question 2, IDA principal disbursements in the past decade were grouped by project name. GROUP BY and SUM were used to add principal disbursements with identical project names. They were sorted in descending order by principal with ORDER BY.
As you can see, it is hard to understand what some of these projects mean. Furthermore, there are hundreds of projects, making it difficult to understand the “big picture” without doing a lot of research. In order to mitigate this problem, a query was used to group these project names into simpler categories. A CTE was used with CASE in order to group the project names by substrings.
Here is what the table queried from the CTE alone looks like, ordered by principal in descending order. 
After the CTE was created, the project names were grouped into categories and SUM was used to find the total principal disbursements for each category.
Fine-tuning the substrings to categorize the hundreds projects would have been exhausting. This is why there are still many “other” values. However, it was still possible to extract meaningful information. In the past 10 years, India has mostly received IDA funding for education, agriculture, and water & sanitation. For this query, there is a large amount of bias. This is because many of the project names are very specific and can easily be miscategorized.
Key Findings
- In the past decade, Tuvalu has recieved the most funding per capita from the IDA.
- In the past decade, most of India’s IDA fundings have gone towards education, agriculture, and water supply & sanitation.
What I Learned
- I Learned how to use Azure Data Studio.
- I learned how to use CTEs
- I learned how to combine 2 data sources into one meaningful table using INNER JOIN.
- I learned how to use CASE and LIKE.
- I learned how to use WHERE, GROUP BY, ORDER BY, and other functions.
Possible Future applications
Combining SQL and Python enhances data analysis by leveraging SQL’s querying power and Python’s machine-learning capabilities. A possible practical application of this integration highlights its potential for future data projects. I will specifically apply skills that I have learned in this project. Of course, this is just an idea. I have no idea if IDA funding alone is enough to accurately predict growth in GDP.
Practical Example: Analyzing Spending Categories and GDP Growth:
- Categorize project names into simpler categories using SQL as I did in problem 2. This would be done for all countries in the dataset.
- Import data featuring GDP growth for each country over a period of time. Combine this data with the categorized data, as demonstrated in problem 1.
- Set GDP growth as the output and set the categories as the features. One-hot-encode the feature data.
- Perform cross validation and find a model that yields the highest possible accuracy on the test data.
- Analyze the weights to see which category of spending is most effective at boosting a countries GDP.
Throughout my graduate studies, Python has been my go-to language for various tasks, even for data cleaning. I can’t help but wonder how much easier the process would have been if I had known about SQL. The power of SQL in handling data manipulation and querying is undeniable, and I am excited to expand my knowledge in this area. Furthermore, as I reflect on my experiences, I can’t help but wonder if there’s a simpler way to categorize these complex project names. If you, the reader, have any insights or suggestions on this matter, I would be genuinely curious to hear them.


